http://ingrimayne.com/econ/AllocatingRationing/MeasuringIncomeDist.html
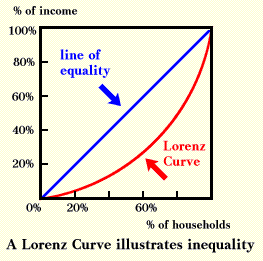
The lorenz curve is used to show inequality in a data set of numbers or in a area when referring to cartography. When illustrated it is the curved line below the line of equality which illustrates that data is not always equal. The lorenz curve shows the variance in a data set. The lorenz curve above is illustrated by the red curved line which represents the inequality between households and income.

No comments:
Post a Comment